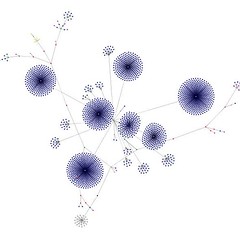
Here is a more complicated web graph
I noticed that lorenzodom does a lot of great tagging and documenting of his photos. It leads to more complexity and a more interesting photo collection
This is a snapshot of lorenzodom flickr all tags page
www.flickr.com/photos/lorenzodom/alltags/
He has several thousand tags amongst his 16982 photos as of 22 August 2006
For a comparison of complexity, see a graph of my alltags page (~ 1/4 to 1/5 as complex)
http://www.flickr.com/photos/brewbooks/222876313/in/set-72157594248410291/
see www.aharef.info/static/htmlgraph/
Try a search for the tag websitesasgraphs to see some other very interesting patterns
I learned about this from r.rosenberger websitesasgraphs
www.flickr.com/photos/rrosie/sets/72157594152137978/
What do the colors mean?
blue: for links (the A tag)
red: for tables (TABLE, TR and TD tags)
green: for the DIV tag
violet: for images (the IMG tag)
yellow: for forms (FORM, INPUT, TEXTAREA, SELECT and OPTION tags)
orange: for linebreaks and blockquotes (BR, P, and BLOCKQUOTE tags)
black: the HTML tag, the root node
gray: all other tags
Labels: 2006, art, photography
posted by brewbooks at
7:26 PM
![]()


0 Comments:
Post a Comment
Subscribe to Post Comments [Atom]
<< Home